You can make data into a graph to display data changes that will be instantly recognizable.
Inserting a chart
Perform the following to insert a chart.
- Click the Chart
 icon on the Menu Bar. Or click Insert-Chart.
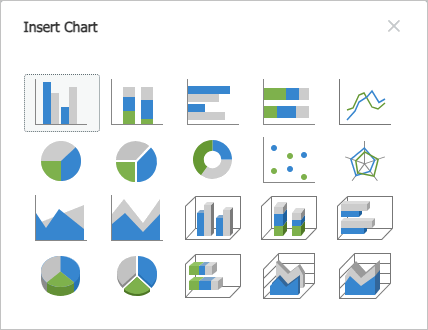
 - Select the chart type on the Insert Chart dialog box.
- Enter data in the Edit Chart dialog box and close it.
- Check if the chart looks as you intended.
Switching row/column
To set chart data direction by row or column, do the following:
- Select the chart you want to switch row/column data.
- In the Chart task pane at the right, click the Switch Row/Column
 icon.
icon.
Adding chart components
To add components to your chart such as data labels and gridlines, do the following:
- Select the chart you want to add components to.
- In the Chart task pane at the right, click the
 icon of Data Labels under Chart Labels, and then select the location from the list.
- In the Chart task pane, click to select the Hozontal or Vertical gridlines icon you want to display under Gridlines.
Was this article helpful?
That’s Great!
Thank you for your feedback
Sorry! We couldn't be helpful
Thank you for your feedback
Feedback sent
We appreciate your effort and will try to fix the article